Flutter App Performance Optimization: What Matters in Production
Teams that ship performant Flutter apps measure before they optimize. Here is the complete production guide covering rendering, memory, network, state management, and CI monitoring.
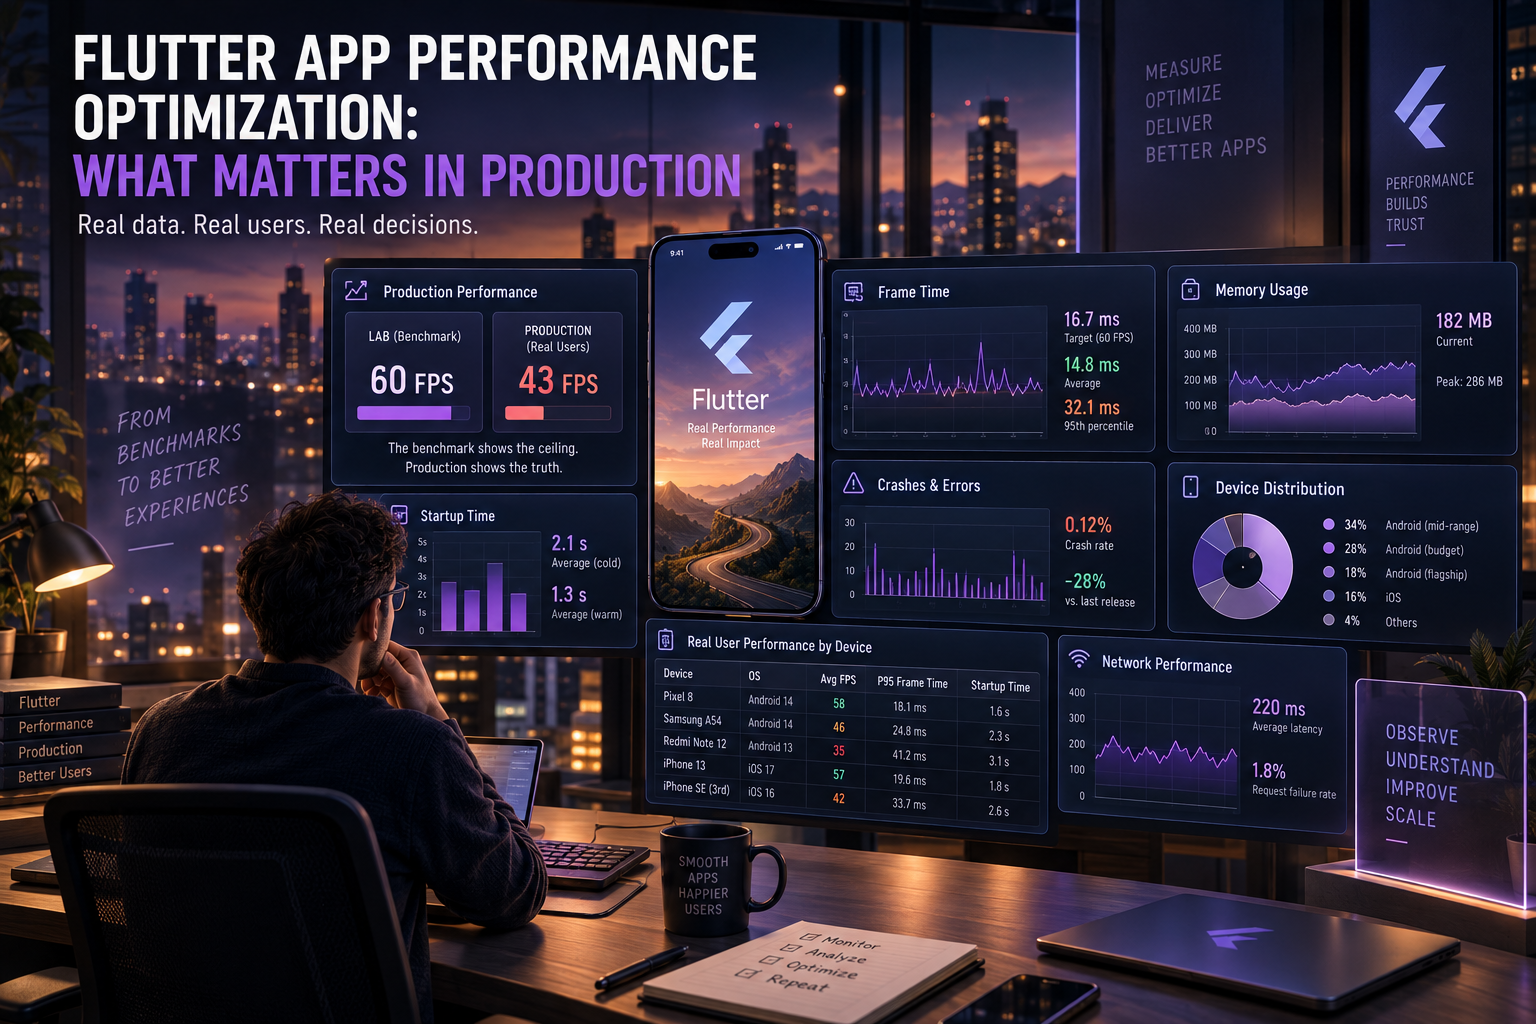
Flutter's benchmark numbers look compelling on paper. Average frame render time of 1.72 milliseconds with a p95 of 2.45 milliseconds, cold startup at 2.1 seconds, consistent 60 frames per second under animation stress where React Native averages 48 frames per second. The Impeller rendering engine, which replaced Skia as the default renderer across platforms, has closed most of the performance gap that Flutter critics cited in earlier years.
None of that tells you what happens to your specific app when it reaches production with real users, real device diversity, real data volumes, and real usage patterns that no benchmark test replicates.
The teams that ship Flutter apps that perform well in production share a specific discipline: they measure before they optimize, they prioritize the problems that users experience rather than the ones that benchmark tools surface, and they build performance monitoring into the delivery pipeline rather than treating performance as a pre-launch checklist item. The teams that ship Flutter apps with production performance problems share a different pattern: they trusted the framework benchmarks, skipped the profiling, and discovered the real problems after the reviews started mentioning lag.
This guide covers what performance actually means in production Flutter applications, which optimization areas deliver the most return, and how to build a performance practice that catches problems before users report them.
Marka's team builds Flutter applications for enterprise clients across regulated industries including healthcare, finance, and manufacturing. Performance architecture is part of every engagement from the design phase, not a retrofit after launch. If you are planning a Flutter application and want to get the architecture right before the first sprint, the conversation starts at marka-development.com/contacts.
The Production Performance Problems Benchmarks Do Not Measure
Flutter's headline benchmark performance reflects a controlled environment: a single test device, a fixed dataset, a defined interaction sequence. Production performance reflects everything that controlled environment excludes.
Device diversity is the most significant gap. Your benchmark device is probably a current-generation flagship. Your production users are running a distribution of devices that spans three to five years of hardware, with a long tail of mid-range and budget Android devices where the performance envelope is dramatically narrower. An animation that renders at 60 frames per second on a Pixel 8 may render at 35 frames per second on a two-year-old mid-range device. The benchmark tells you the ceiling. It does not tell you the floor that your actual user base experiences.
Data volume at production scale separates apps that perform well in testing from apps that perform well in use. A list that renders 50 items smoothly in a test environment may render 5,000 items with perceptible lag in production. A search that returns instant results against a test database may return results with noticeable delay against a production database with millions of records and concurrent users. The benchmark dataset is clean, bounded, and optimized for the test. Production data is none of those things.
User interaction patterns in production are not the happy path that test scripts follow. Users scroll faster than test scripts scroll. They switch between screens in sequences the test did not anticipate. They leave the app in the background and return to it in states the test did not cover. The interaction patterns that produce jank in production are precisely the ones that benchmark tests were not designed to replicate.
This is why the starting point for Flutter performance optimization is not applying a list of techniques. It is instrumenting the production app to understand where the actual performance problems are, in the hands of actual users, on the actual devices they use. Everything before that measurement is optimization theater.
Rendering Performance: The Highest-Leverage Area
Flutter's rendering model compiles directly to native machine code rather than using a JavaScript bridge. This is the architectural reason Flutter achieves 96 percent of native Android performance and 91 percent of native iOS performance in cross-framework comparisons. It is also the reason rendering performance problems in Flutter are usually not framework problems. They are application problems caused by how the widget tree is built and rebuilt.
Unnecessary widget rebuilds are the most common production rendering problem. Flutter's reactive UI model rebuilds the widget subtree whenever state changes. When state is managed at too high a level in the widget tree, a state change that should only affect one widget triggers a rebuild of an entire screen's widget tree. The result is dropped frames during interactions that should be smooth.
The diagnostic tool is Flutter DevTools' widget rebuild tracker, which shows which widgets rebuilt during an interaction and how many times. A widget that rebuilds 40 times during a scroll that should trigger zero rebuilds is the signal that state management scope needs to be narrowed. The fix is moving state down the widget tree to the lowest level that needs it, using const constructors for widgets whose properties do not change, and using RepaintBoundary to isolate expensive subtrees from parent rebuilds.
The const keyword is underused in production Flutter codebases. Marking a widget constructor as const tells the Dart compiler that the widget's properties will never change, allowing the runtime to cache and reuse the widget instance rather than recreating it on every build pass. In large widget trees with many static elements, systematic use of const constructors measurably reduces build phase time. Linters can identify missing const opportunities automatically. The fix is low-risk and the return is consistent.
ListView.builder for any list longer than the visible viewport. A standard ListView with children passed as a list builds all child widgets on construction, regardless of whether they are visible on screen. ListView.builder builds only the widgets currently visible plus a configurable buffer. For lists with more than 20 to 30 items, the difference in initial build time and memory usage is significant. At production data volumes where lists may contain hundreds or thousands of items, the standard ListView creates a class of performance problem that does not exist in test environments where the dataset is small.
The Impeller Renderer: What Changed and What It Means for Optimization
The transition from Skia to the Impeller rendering engine, now the default on both iOS and Android in Flutter 3.x, changes the specific performance problems that developers need to optimize for.
Shader compilation jank was the most frequently cited Flutter performance complaint before Impeller. The Skia renderer compiled GPU shaders on demand when animations ran for the first time, producing visible stutter on the first run of any animation. Impeller pre-compiles shaders at build time, eliminating this class of jank entirely. Teams optimizing Flutter applications that were built before Impeller, and that added shader warmup workarounds to compensate for Skia jank, can remove those workarounds after migrating to Impeller. The workarounds are no longer doing anything useful and add build complexity without benefit.
What Impeller does not eliminate is raster thread overload from genuinely expensive rendering operations: large images without proper caching, complex blur effects, clip operations on large surfaces, and non-rectangular clip paths that require expensive per-pixel operations. These operations are still expensive on the GPU, and Impeller's improved architecture does not make expensive GPU operations free. They make them more consistent and predictable, which makes them easier to identify and optimize.
The Performance Overlay, accessible by setting showPerformanceOverlay: true in the MaterialApp or by enabling it in DevTools, visualizes both the UI thread and Raster thread frame budgets in real time. A green bar means the frame completed within the 16 millisecond budget for 60 frames per second. A red bar means the frame exceeded the budget and a dropped frame occurred. The distinction between which thread is overloaded, UI or Raster, tells you whether the problem is in Dart code (UI thread) or GPU operations (Raster thread), which points to different diagnostic and optimization strategies.
Memory Management in Production Flutter Applications
Memory management is where Flutter production performance diverges most sharply from benchmark conditions. Benchmark tests run for a defined duration on a clean device state. Production apps run for extended sessions on devices with fragmented memory, background processes competing for resources, and user sessions that accumulate state over hours of use.
Image memory is the most common source of production memory pressure. Flutter's Image.network widget caches decoded images in memory. A feed-style application that displays large images as the user scrolls can accumulate hundreds of megabytes of decoded image data in memory without any explicit caching configuration. On devices with limited RAM, this produces the combination of sluggish scrolling and eventual process termination that users experience as the app crashing.
The cached_network_image package provides disk caching that persists images between sessions and memory cache management that respects device memory constraints. The ResizeImage widget reduces images to the dimensions actually displayed rather than storing full-resolution images decoded at display time. For image-heavy applications, combining these two approaches typically reduces memory usage by 40 to 60 percent without visible quality degradation, because the images were already being downscaled by the device display before the memory reduction.
Disposable resources that are not disposed. Dart's garbage collector handles most memory management automatically, but resources that register callbacks, listeners, or streams require explicit disposal when the widget that owns them is removed from the tree. An animation controller that is not disposed continues consuming resources. A stream subscription that is not cancelled continues receiving events and holding references. An HTTP client that is not closed keeps connections open. In a production application where users navigate through many screens over an extended session, undisposed resources accumulate into the memory growth pattern that manifests as sessions that start fast and slow down over time.
The discipline of implementing dispose() in every StatefulWidget that creates disposable resources is not optional in production applications. In large codebases where the dispose obligation is easy to miss during code review, static analysis rules that flag missing dispose calls catch these issues before they reach production.
Network Performance and Offline Behavior
Network performance in Flutter production applications is determined more by architecture decisions than by framework optimization. The framework cannot make a slow API fast, but it can make the application's behavior during slow or unavailable network conditions graceful rather than broken.
Optimistic UI updates. Rather than waiting for a server confirmation before updating the UI, optimistic UI shows the expected result of an action immediately and reconciles with the server response when it arrives. A user who marks an item as complete sees it marked immediately rather than waiting for the network round trip. If the server returns an error, the UI reverts. For actions where server failures are rare, optimistic UI produces perceived performance improvements that network optimization cannot match because the perceived latency is reduced to zero.
Offline-first architecture for applications with intermittent connectivity. Enterprise applications deployed on mobile devices cannot assume reliable connectivity. An offline-first architecture stores the data the application needs locally, syncs with the server when connectivity is available, and queues write operations for later synchronization when the device is offline. The drift package provides SQLite-backed local storage with a type-safe Dart API. isar provides a faster local database with better performance for query-heavy workloads. The choice between them depends on query complexity and the volume of locally stored data, not on framework compatibility.
Request deduplication and caching. A screen that makes the same API call multiple times during its lifecycle, once when mounted, once when the user pulls to refresh, and once when a dependency changes, creates unnecessary server load and extends the time before the user sees complete data. Request deduplication ensures that simultaneous identical requests share a single network round trip. Response caching serves stored responses immediately while refreshing in the background. Both patterns are available through the dio HTTP client with appropriate interceptor configuration, or through state management solutions like Riverpod's AsyncNotifier that handle request lifecycle natively.
State Management and Its Performance Implications
State management is not primarily a performance topic, but state management architecture decisions have direct and significant performance consequences in production Flutter applications. The most performance-relevant state management decision is not which package to use. It is how granularly state is scoped.
Riverpod's provider model, which scopes state to the smallest widget subtree that needs it and rebuilds only the widgets that consume changed state, produces better production performance than architectures that store all application state in a single top-level object and rebuild from the root on every change. This is not a statement about Riverpod specifically. It is a statement about the performance consequence of state granularity, which applies regardless of whether the implementation uses Riverpod, Bloc, or any other state management approach.
The diagnostic pattern that identifies state management as a performance problem is finding that a user interaction that should affect a small part of the screen is triggering rebuilds across large portions of the widget tree. The DevTools widget rebuild tracker makes this visible. The fix is narrowing the scope of state to the widgets that actually consume it, which requires a state management architecture that supports granular subscriptions rather than broadcasting all state changes to all listeners.
Build Configuration for Production Performance
Flutter's build configuration options for release builds include several settings that significantly affect production performance and that are distinct from debug build behavior.
AOT compilation, which is the default for release builds, compiles Dart code to native machine code before distribution rather than at runtime. Debug builds use JIT compilation for hot reload support. The performance difference between AOT and JIT in release versus debug builds is significant enough that any performance testing done in debug mode does not reflect production performance. All production performance testing must run against release builds on physical devices.
App size affects download conversion rates, which is a business performance metric even if it is not a rendering performance metric. Flutter's tree shaking, which removes unused code from the final build, and --split-debug-info, which moves debug symbols out of the release binary, reduce app size without affecting runtime performance. For applications targeting markets with significant populations on metered data connections, app size is a user acquisition performance metric as directly relevant as frame rate.
Deferred loading allows parts of a Flutter application to be loaded on demand rather than at startup, reducing initial load time for applications with features that most users never access. A Flutter application where 30 percent of the code is used by 5 percent of users is a candidate for deferred loading of that 30 percent.
The Performance Monitoring Practice That Prevents Production Surprises
Performance optimization applied after a production performance problem is reported is consistently more expensive than performance monitoring that detects degradation before users report it. The practices that separate teams with consistently performant production applications from those reacting to user complaints are instrumentation, regression testing, and monitoring, in that order.
Frame timing instrumentation in production builds. Flutter's SchedulerBinding.instance.addTimingsCallback reports frame timing data in production builds without requiring a developer tools connection. Logging frames that exceed 16 milliseconds and reporting them to an analytics backend gives production visibility into jank frequency across the actual device distribution your users are on, not the test device you have on your desk.
Performance regression testing in the CI pipeline. Flutter's flutter test --profile mode runs widget tests with AOT compilation, allowing frame timing measurements to be included in automated test runs. A CI check that fails when a key user interaction drops below a frame time threshold catches performance regressions before they reach production. The alternative is discovering regressions in production reviews.
Real user monitoring. Third-party RUM solutions including Firebase Performance Monitoring, Sentry's performance tracing, and Datadog Mobile RUM provide production frame timing data, network request latency, and app startup time segmented by device model, OS version, and application version. This segmentation is what transforms performance data from an aggregate number into an actionable finding: frame rate on Android 11 devices with 4GB RAM is below the 60 frame per second target, while performance on Android 13 devices with 8GB RAM is within budget.
The combination of CI-based regression testing and production RUM covers both the prevention of introduced regressions and the detection of degradation from factors outside the codebase: OS updates, device diversity changes in the user base, and data volume growth that changes the performance profile of operations that were within budget at launch.
Building these practices requires engineering investment that pays for itself the first time a performance regression is caught in CI rather than in a one-star review. For enterprise applications where user trust and retention are directly tied to application quality, the investment is not optional. It is the practice that keeps performance an engineering concern rather than a customer relations concern.
Marka's Flutter engineering practice covers performance architecture from the design phase through post-launch monitoring. You can review the team's enterprise software development expertise or get in touch to discuss how performance requirements should shape your application's architecture before a line of code is written.